Dr Arnaud Zoubir1 & Marie-Sophie de Maissin2
Introduction
Spectroscopy has long been used in gemology for the characterization and identification of gems. A spectroscope makes it possible to measure the wavelengths of white light absorbed by the material and thus to deduce information on the chemical nature of the objects measured. When a gem is observed on the spectroscope, the wavelengths absorbed appear in the form of dark bands, more or less fine, superimposed on the image of the spectroscope which is similar to a rainbow (that is, the entire spectrum of visible light).
Different types of spectroscopes exist. They consist of a set of optical components including an entrance slit, a lens and an element capable of separating the wavelengths of light such as a prism or a diffraction grating. Their use consists of positioning the gem under white light and observing with the naked eye the light transmitted (or reflected) by the gem through the spectroscope. It is thus possible to visualize the absorption spectra of the gems, either in transmission or in reflection.
However, this tool has several drawbacks: first, some spectroscopes do not display the wavelength scale (usually graduated in nanometers). The precise position of the characteristic peaks or absorption bands cannot therefore be measured, making the observation inacurate. Moreover, the use with the naked eye of the spectroscope generates in the long run a discomfort and important visual fatigue. Also, the human eye is a very sensitive organ qualitatively but very little effective from a quantitative point of view: it does not allow precise measurement of absorption or transmission at a wavelength of interest, making it impossible to compare certain gems whose differences are sometimes subtle. Finally, the spectroscope does not record a spectrum and the gemologist will have to rely on his memory or a written transcription of what he sees to archive his spectra. Not to mention the impossibility of communicating to others the spectra he visualizes.
Micro-spectrometers represent a new generation of ultracompact equipment for spectral measurements, finding applications in many fields. Combined with a laptop or a smartphone, they allow a more precise and rigorous measurement of light spectra, compared to the eye-based spectroscope, while maintaining a very high portability. It is thus possible to precisely measure the position of the absorption bands, to compare several spectra, to record them or to share them by sending them by email. In other words, micro-spectrometers can not only “visualize” the spectrum of gems but also measure, record, analyze, compare or export them. They thus have all the advantages of laboratory spectrometers, including for field measurements.
This article presents the results obtained with GoSpectro, a micro-spectrometer developed by the ALPhANOV Technology Center (shown in Figure 1). This device has the advantage of being usable with any smartphone equipped with a camera. By “looking” at a light source or object through the GoSpectro, you can see on the screen the spectrum of light emitted, transmitted or reflected by the object.
This spectrometer has been tested for gemological applications. We have thus explored several case studies such as the characterization of certain ruby or garnet varieties, the fluorescence of natural and synthetic spinels or the characterization of different tourmalines.

Figure 1 – Photo of GoSpectro, ultra compact spectrometer for smartphone
From spectroscope to spectrometer
What is the difference between a spectroscope and a spectrometer? The answer is in the etymology of words: The spectroscope “sees” while the spectrometer “measures”. Thus the spectrometer will not only be able to identify the typology of the absorption bands (fine lines, wide lines, doublets, cuts, flag spectrum, etc.) but also to measure the characteristic wavelength values and the “relative” heights of lines that will be more or less intense according to several gems that we want to compare.
Figure 2 below shows, in the case of the ruby, the comparison between the “rainbow” spectrum as it should be seen with the naked eye through a spectroscope and the spectrum measured by the “GoSpectro” spectrometer. Red is positioned on the right for easy comparison.
We thus find the broad absorption band centered on the green (550 nm). The cutoff in the blue is around 450nm. The fine lines are not directly visible with the spectrometer (observation with a spectroscope of average quality also did not allow to observe them with the naked eye). This is because the spectral resolution of the two devices used was not sufficient for this. Nevertheless, while they were absolutely not visible on the spectroscope, these absorption lines can explain the slight inflection visible on the GoSpectro curve around 450 nm and 650 nm. The emission doublet at 700 nm, characteristic of the ruby, is clearly visible with the GoSpectro. This doublet could not be visualized with the spectroscope because the difference of intensity in these observation conditions (lighting by a halogen lamp) was not sufficient for the eye.
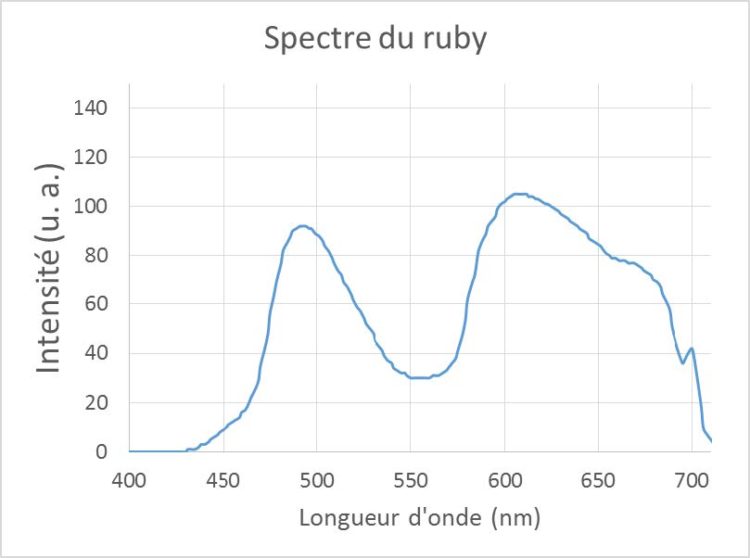
Figure 2 – Comparison between the theoretical spectrum of the ruby and the spectrum measured at GoSpectro
From color to spectrum
Color provides important information to the gemologist. In addition to its aesthetic value, it is important information in the analysis and understanding of gems.
Tourmaline is an example of gems with different colors depending on the presence of different chemical elements.
Tourmaline is a cyclosilicate crystallizing in the rhombohedral system and having a very complex chemical formula: (Na, Ca) Al12 (Fe, Mg, Li2) 6 (OH, F) 8 (Bo3) 6 (Si6 O18) 2. Tourmaline is considered a “trash mineral” because it includes many chemical elements during its formation. Its color varies according to the chromogenic elements that it meets during its growth.
Tourmaline is an allochromatic mineral with a wide range of colors (pink, red, yellow, brown, blue, green, purple, black, etc.), but may also be colorless or multicolour, such as:
- watermelon tourmaline: pink heart and green periphery
- Tourmaline Moorish head: from colorless to black
- Tourmaline Turk’s head: from green to red
Figure 3 below shows the absorption spectra of three types of tourmaline: a yellow tourmaline (blue curve), and two pink tourmaline (rubellite) of two slightly different hues. Not surprisingly, yellow tourmaline has an absorption peak in the blue part of the spectrum around 490 nm.
It is this absorption which confers on it its yellow color, that is to say the complementary color of the absorbed color. The two rubellites also show an absorption band, but more pronounced (more intense color) and rather centered on the green part of the spectrum, explaining the pink hue, complementary to the green color.
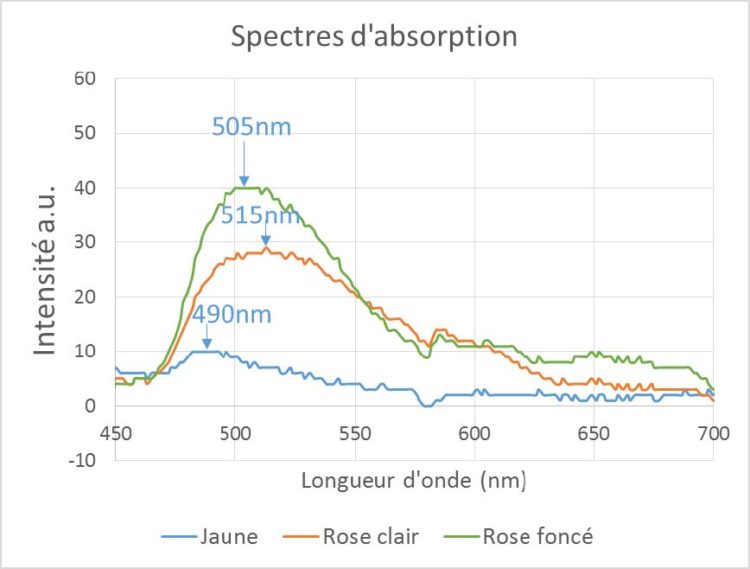
Figure 3 – Absorption spectrum of several tourmalines of different colors
What is the difference between red and red?
The previous example showed that we could measure, or even anticipate in some cases, the absorption spectrum of gems with different colors. The spectrum then has an absorption band centered on the area of the spectrum corresponding to the color complementary to the hue of the stone.
But what about chemically different stones with very similar colors? Is it possible to differentiate them based on their spectrum, whereas it is difficult, if not impossible, to do so from the simple visual observation of their own?

Pyrope Almandin Glass
Garnets are a family of minerals from the group of neo-crystalline crystals crystallizing in the cubic (or isometric) crystal system. For the experiment, we used 2 garnets of the series of pyralspites (pyrope, almandine), which are aluminous silicates of general chemical formula X3Al2Si3O12 where X denotes Mn, Mg or Fe2 +. The following appellations are used for the different garnets of simple composition satisfying this general formula:
| Name | Formula |
| Pyrope | Mg3Al2Si3O12 |
| Almandin | Fe3Al2Si3O12 |
| Spessartine | Mn3Al2Si3O12 |
The Pyrope and Almandin species make up the majority of garnets and are often present in combination (solid solution). These minerals have a high refractive index (1.74 to 1.83) which sometimes makes it difficult to identify them by refractometry.
With hues ranging from red to purplish, it is not always easy to differentiate them with the naked eye. However, these gems have specific spectral characteristics to distinguish them from each other using the spectrometer. The transmission spectra are shown in Figure 5.
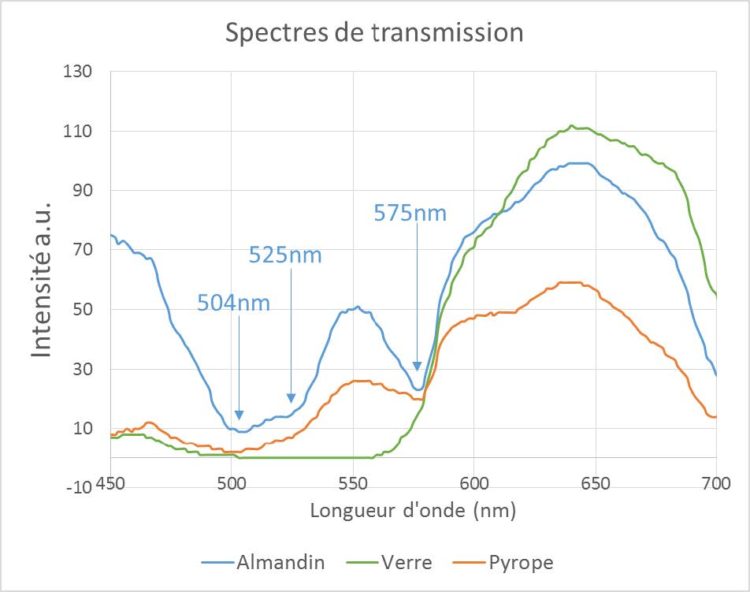
Figure 5 – Spectrum of transmission on red gems
The spectrum of Pyrope (orange curve) and Almandin (blue curve) show a common absorption band at 575 nm. But while Almandin appears to have two relatively narrow absorption bands at 504 nm and 525 nm and good transparency in blue, absorption of the Pyrope extends to 400 nm. By comparison, the spectrum of a red glass whose color is very similar to these gems is also shown (green curve). The latter presents a spectrum of a typology still different from the first two, with an almost total absorption up to 570 nm and a large window of transparency up to 700 nm.
It is therefore possible, from these spectra, to distinguish not only the glass sample of garnets, but also to distinguish the two types of garnets from each other (almandin and pyrope). As spectroscopists are well aware, absorption spectroscopy, which probes electron transitions giving color to matter, is less specific than vibrational spectroscopy (for example, Raman spectroscopy). Indeed, vibrational spectroscopy makes it possible to probe the vibrations between the atoms that make up matter. It provides very characteristic spectra of the analyzed material, presenting relatively fine peaks and which together constitute a real identity card for a given gem. However, this method based on an ultra-portable visible absorption spectrometer provides an efficient and accessible way for all in terms of cost and ease of use to conduct first field assessments.
And the fluorescence in all this?
Fluorescence spectral measurement is another method on which gemologists can rely in their analysis work. Fluorescence in gems is usually caused by the presence of metal ions such as chromium, manganese, cobalt or nickel.
The fluorescence of some gems was measured using GoSpectro. A green laser pointer emitting at 532 nm is used to illuminate the gems. A typical fluorescence spectrum, obtained on a ruby, is shown opposite. The spectrum contains the laser excitation line at 532 nm, as well as a fluorescence spectrum in the red region of the spectrum between 600 and 700 nm with a characteristic peak at 695 nm. This spectrum is characteristic of chromium ions that can be found in many gems.
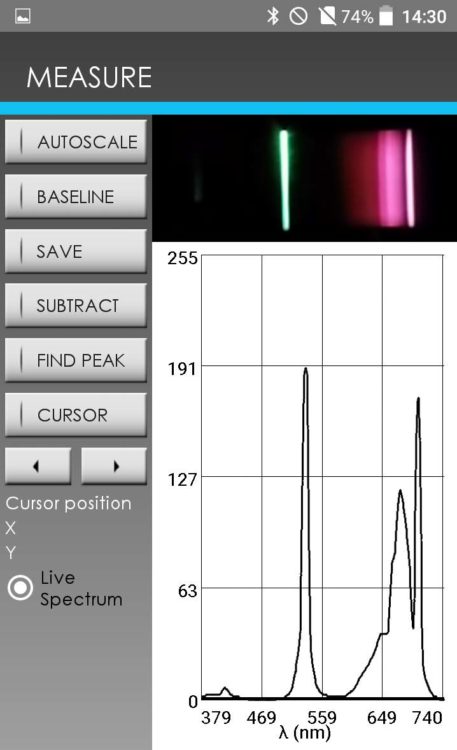
Figure 6 – Screen shot of GoSpectro showing a fluorescence spectrum on ruby excited by a laser pointer at a wavelength of 532 nm
Fluorescence is sometimes present in some synthetic gems while the natural version of this same gem does not fluoresce. This is the case of spinel. This is due, in particular, to the presence of iron in natural spinel.
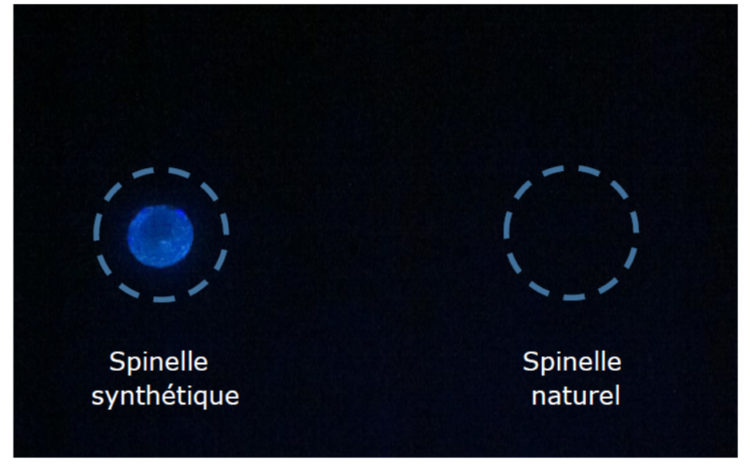
Figure 7 – Photograph of synthetic spinel and natural spinel under UV light
The fluorescence spectrum was recorded by exciting the gem using a commercial laser pointer emitting at 405 nm. The same protocol was operated in the case of synthetic spinel and natural spinel. Yet only synthetic spinel has a fluorescence spectrum visible on the spectrometer. This is a broad emission band from 500 nm to 650 nm. Natural spinel shows only the emission line of the 405 nm laser that emanates from the gem due to the phenomenon of elastic scattering.
This is an interesting solution and offers great portability to measure in the gems the fluorescence of the ions present, generated using a simple laser pointer operating on battery. It should be noted that, in comparison with an eye-based spectroscope, the spectrum is here measured by the photo sensor of the smartphone, rather than the eye of the gemologist. This greatly reduces the eye safety risks to which the user is exposed by using a laser.
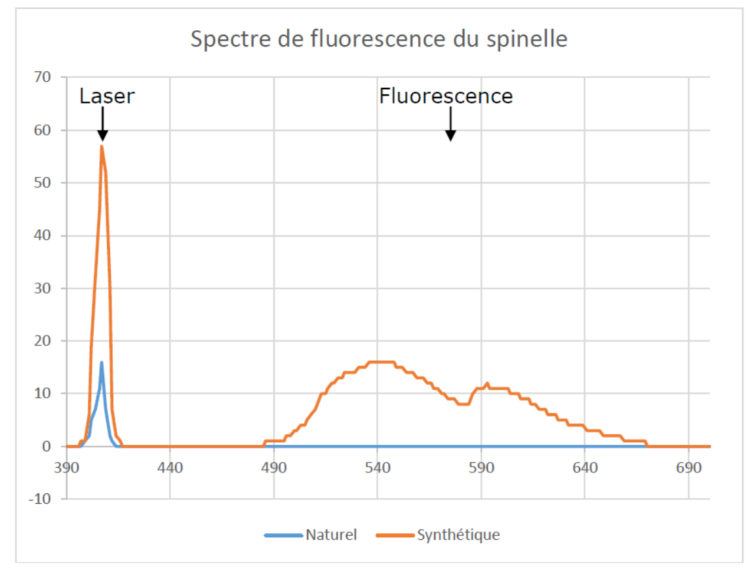
Figure 8 – Fluorescence spectra of synthetic spinel and natural spinel excited by a laser pointer at a wavelength of 405 nm
Conclusion
GoSpectro allows the spectral characterization of gems by measuring their transmission (or absorption) and fluorescence spectrum. Gems having a similar appearance and coloration can be differentiated on the basis of their spectral characteristics. Fluorescence, from chromium ions, for example, can also be easily measured, allowing the identification and characterization of a large number of gems.
Compared to an eye-based spectroscope, the measurement is more precise, devoid of any subjectivity, more comfortable and safer (especially when using a laser). The measured spectra can thus be recorded, communicated by email, compared with each other, for analysis. Finally, this new generation of spectrometers has a great portability, a great ease of use compared to laboratory devices, allowing a simple and fast use, directly in the field. Its reasonable cost, similar to an eye-based spectroscope, should make it an indispensable tool for many professional and amateur gemologists.
1 ALPhANOV Technology Center
2 Gemologist, ING, Paris – AIGS, Bangkok
